Welcome to my portfolio website!
Below, you will find a showcase of my skills and experience in data analysis. As a forward-thinking accountant, I believe that data-driven decision making is crucial for business success in the digital age. Through my portfolio, you will see how I use my expertise in data analysis to provide valuable insights and drive strategic decision making for stakeholders. Whether it is identifying trends, uncovering new opportunities, or uncovering cost savings, I use data to help organisations make better business decisions.
I am passionate about understanding the business world. I often write down my thoughts on business and accounting issues steming from emerging topics. In addition, I share my experience and advice to aspiring students looking to join the field of accountancy.
I hope you will find somethings interesting and useful during your time here. Any feedback, feel free to send me an email at caominh1701@gmail.com.
Experience
3+ years of experience working as a Project Accountant/ Management Accountant in the Higher Education sector.
Core skills
Budgeting; Forecasting; Variance analysis; Project financial reporting; Data analysis.
Software
TechnologyOne Financials; Excel (Power Query, Power Pivot); PowerBI (+Dax); Basic SQL.
Education
CPA (Aust.); MBA(I) UTAS; BCom UniMelb.
Click here to DOWNLOAD my resume.

Advance my exploratory data analysis skills using Excel as the tool of choice.

Building an executive dashboard for senior management, using a simplified version of the famous Northwind dataset.

I explored family leave policies in this challenge from Maven Analytics.

I joined an HR data challenge by Arno Wakfer to answer questions from top management about the staff profile.

I built an interactive tool recommending resorts to skiers. I used entirely Excel to send a message to new learners: You can start with simply Excel. It is about the thinking, not the tool.

This project looks at customer profiles to determine high value customers, their churn risk and the overall churn risk of a telecommunication company, helping the management team to improve the rentention rate.

After reading Storytelling with Data by Cole Nussbaumer Knaflic over the holiday period, I applied some concepts in the book (colour/ graph choice, narrative) to my submission to the Maven Space Challenge.

In the spirit of Christmas, I participated in the 25 Days of DAX Fridays! Challenge by Ruth Pozuelo Martinez (Microsoft MVP) at Curbal.

I took on the role of an data analysis to explore the root causes of customer satisfaction level.

A report to illustrate the current landscape of unicorn companies around the globe.

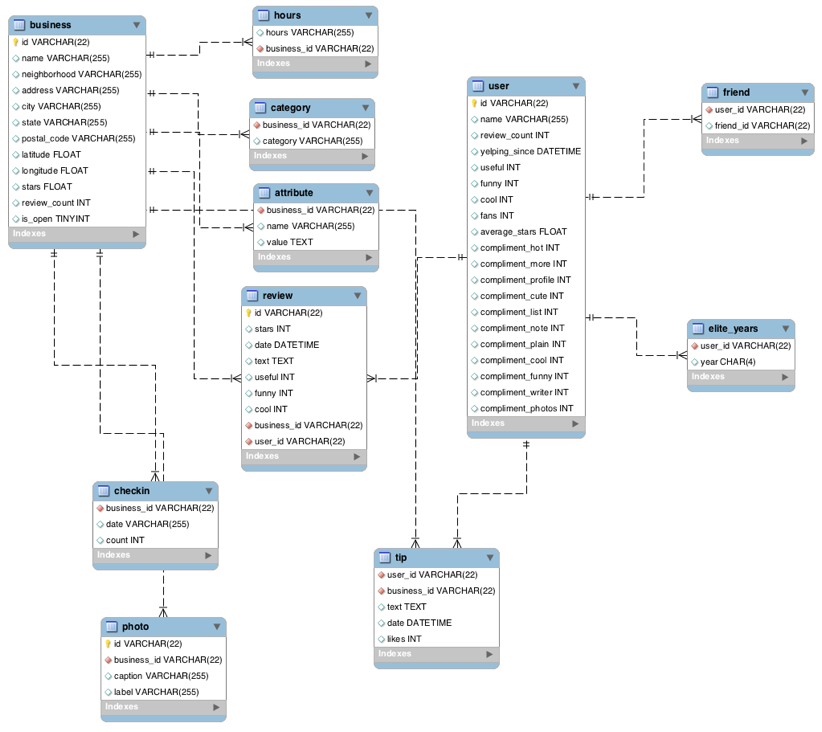
I completed a peer-reviewed assignement analysing business rating data using SQLite. This is the final assessment of the SQL for Data Science course by University of California, Davis.

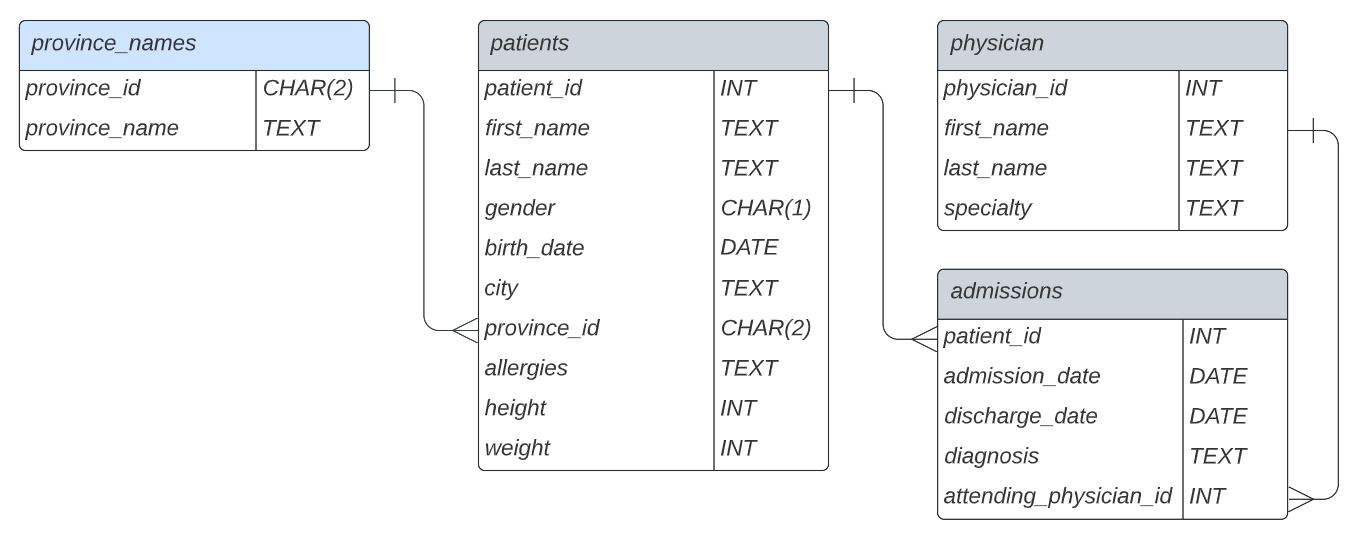
Finally, I solved the last 9 HARD questions on sql-practice.com. Google and Stack Overflow kindly assisted.

I completed further 22 medium level questions on sql-practice.com. The focus is on joins and complex filter conditions.

I completed 16 easy level questions on sql-practice.com, using patients' admission data.

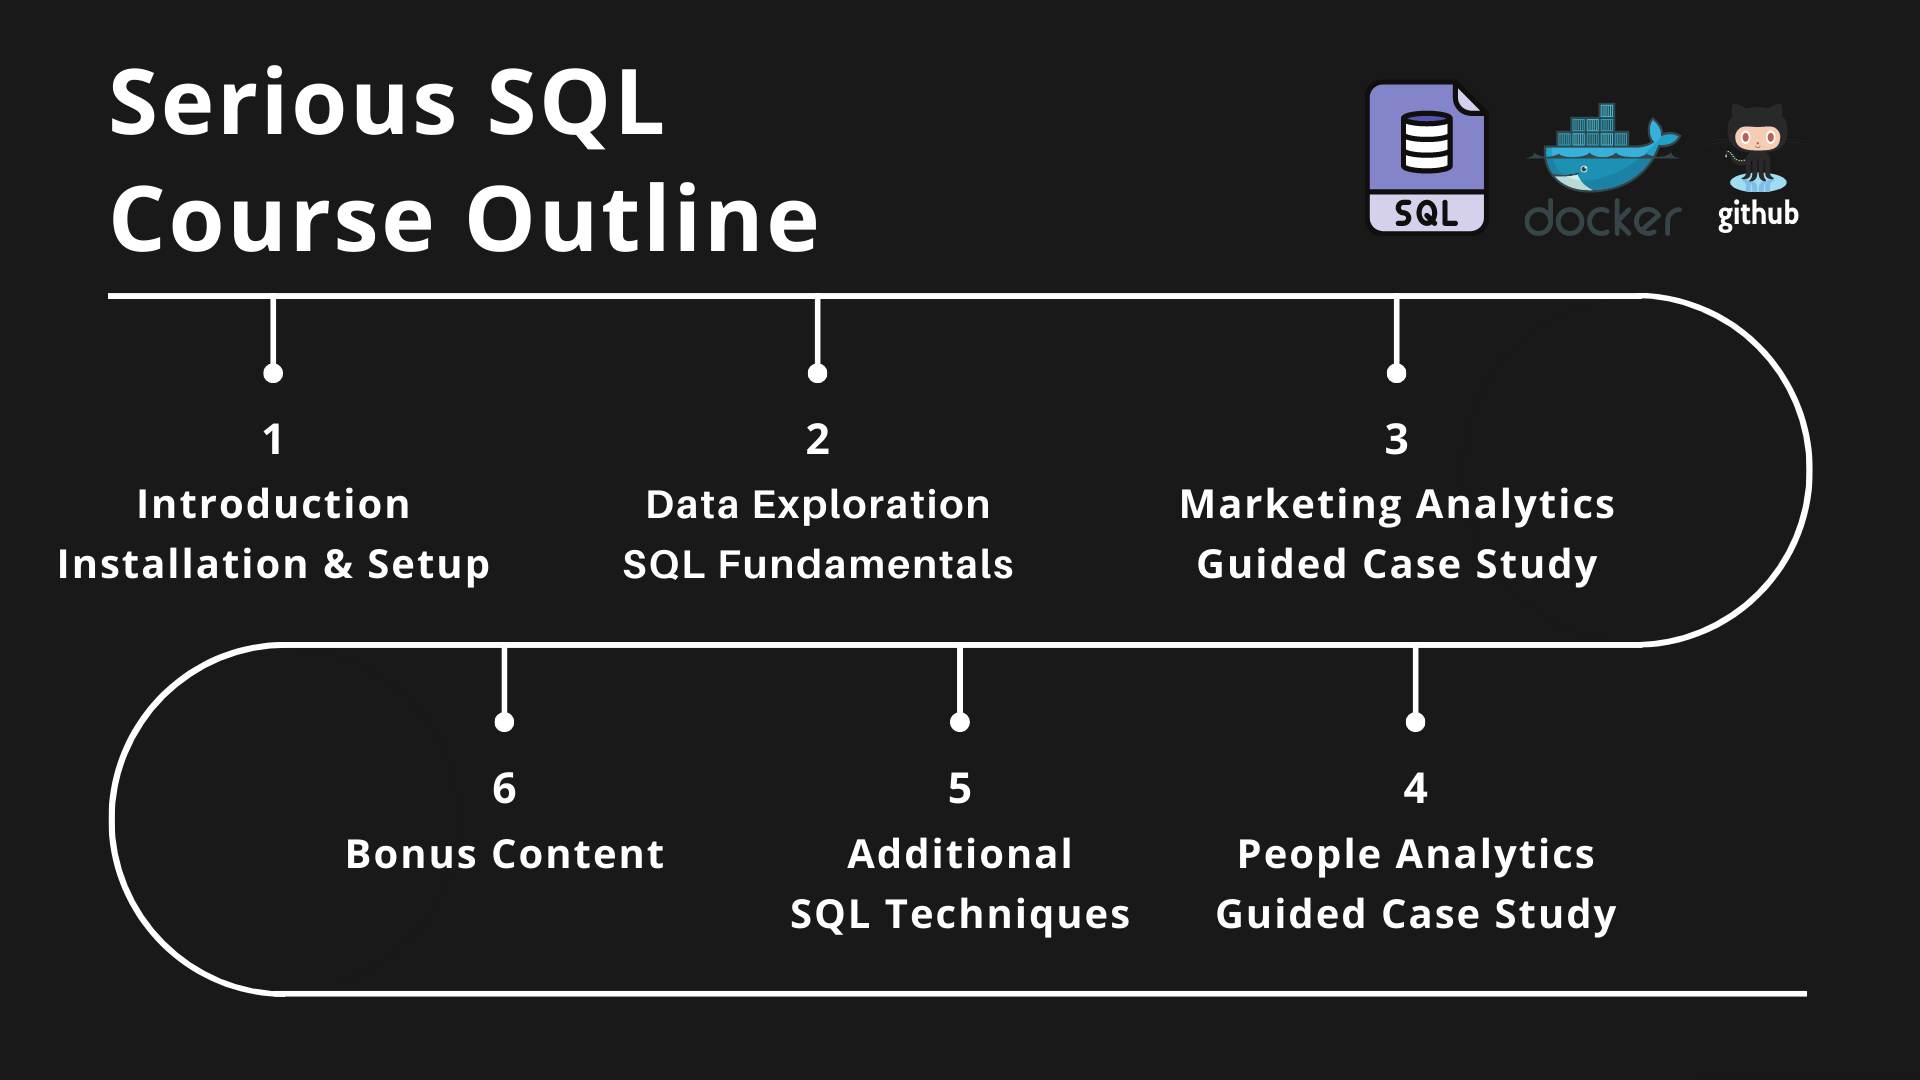
I completed a data exploration task on health data as part of the Serious SQL course by Danny Ma, using PostgreSQL.

My very first PowerBI dashboard. I documented the steps, links, findings and recommendations in this article.


