Yelp data analysis using SQLite
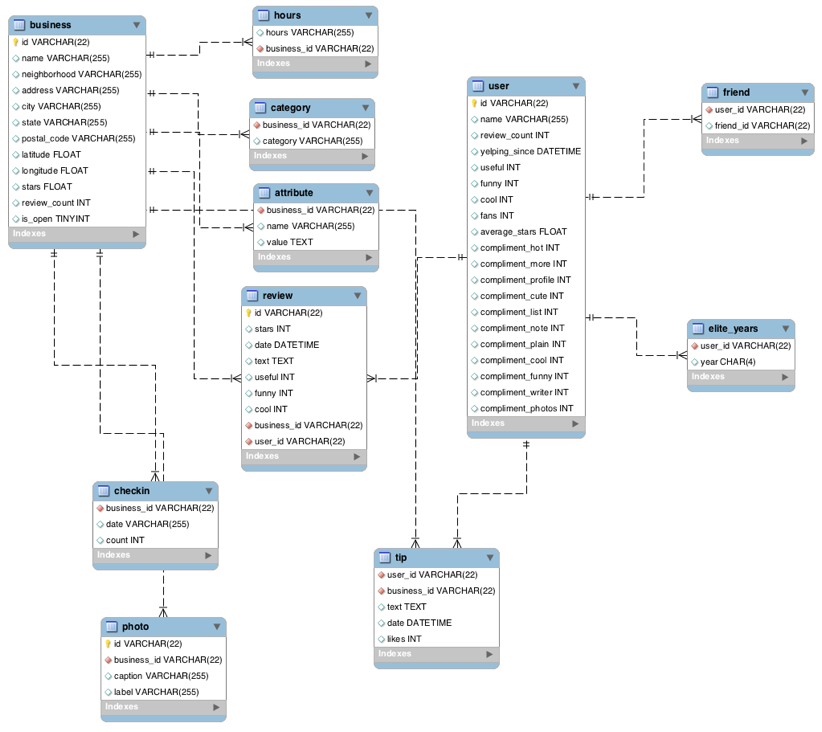 Photo credit: University of California, Davis @ Coursera
Link to GitHub repository, including final codes.
The dataset is from a US-based organization called Yelp, which provides a platform for users to provide reviews and rate their interactions with a variety of organizations – businesses, restaurants, health clubs, hospitals, local governmental offices, charitable organizations, etc. Yelp has made a portion of this data available for personal, educational, and academic purposes.
Part 1: Yelp Dataset Profiling and Understanding
1. Profile the data by finding the total number of records for each of the tables below:
i. Attribute table = 10,000
ii. Business table = 10,000
iii. Category table = 10,000
iv. Checkin table = 10,000
v. elite_years table = 10,000
vi. friend table = 10,000
vii. hours table = 10,000
viii. photo table = 10,000
ix. review table = 10,000
x. tip table = 10,000
xi. user table = 10,000
2. Find the total distinct records by either the foreign key or primary key for each table. If two foreign keys are listed in the table, please specify which foreign key.
i. Business = 10,000 (primary)
ii. Hours = 1,562 (business_id)
iii. Category = 2643 (business_id)
iv. Attribute = 1,115 (business_id)
v. Review = 10,000 (primary)
vi. Checkin = 493 (business_id)
vii. Photo = 10,000 (primary)
viii. Tip = 3,979 (business_id)
ix. User = 10,000 (primary)
x. Friend = 11 (user_id)
xi. Elite_years = 2,780 (user_id)
Note: Primary Keys are denoted in the ER-Diagram with a yellow key icon.
3. Are there any columns with null values in the User table? Indicate "yes," or "no."
Answer: No
SQL code used to arrive at answer:
select count(*) from user
where
id is null or
name is null or
review_count is null or
yelping_since is null or
useful is null or
funny is null or
cool is null or
fans is null or
average_stars is null or
compliment_hot is null or
compliment_more is null or
compliment_profile is null or
compliment_cute is null or
compliment_list is null or
compliment_note is null or
compliment_plain is null or
compliment_cool is null or
compliment_funny is null or
compliment_writer is null or
compliment_photos is null;
4. For each table and column listed below, display the smallest (minimum), largest (maximum), and average (mean) value for the following fields:
i. Table: Review, Column: Stars
min: 1; max: 5; avg: 3.7082
select
min(stars) as minimum,
max(stars) as maximum,
avg(stars) as average
from review;
ii. Table: Business, Column: Stars
min: 1 max: 5 avg: 3.6549
select
min(stars) as minimum,
max(stars) as maximum,
avg(stars) as average
from business;
iii. Table: Tip, Column: Likes
min: 0 max: 2 avg: 0.0144
select
min(likes) as minimum,
max(likes) as maximum,
avg(likes) as average
from tip;
iv. Table: Checkin, Column: Count
min: 1 max: 53 avg: 1.9414
select
min(count) as minimum,
max(count) as maximum,
avg(count) as average
from checkin;
v. Table: User, Column: Review_count
min: 0 max: 2000 avg: 24.2995
select
min(count) as minimum,
max(count) as maximum,
avg(count) as average
from checkin;
5. List the cities with the most reviews in descending order:
SQL code used to arrive at answer:
select
city,
sum(review_count)
from business
group by city
order by sum(review_count) desc;
Copy and Paste the Result Below:
+-----------------+-------------------+
| city | sum(review_count) |
+-----------------+-------------------+
| Las Vegas | 82854 |
| Phoenix | 34503 |
| Toronto | 24113 |
| Scottsdale | 20614 |
| Charlotte | 12523 |
| Henderson | 10871 |
| Tempe | 10504 |
| Pittsburgh | 9798 |
| Montréal | 9448 |
| Chandler | 8112 |
| Mesa | 6875 |
| Gilbert | 6380 |
| Cleveland | 5593 |
| Madison | 5265 |
| Glendale | 4406 |
| Mississauga | 3814 |
| Edinburgh | 2792 |
| Peoria | 2624 |
| North Las Vegas | 2438 |
| Markham | 2352 |
| Champaign | 2029 |
| Stuttgart | 1849 |
| Surprise | 1520 |
| Lakewood | 1465 |
| Goodyear | 1155 |
+-----------------+-------------------+
6. Find the distribution of star ratings to the business in the following cities:
i. Avon
SQL code used to arrive at answer:
select
stars,
count(id)
from business
where city ='Avon'
group by stars
order by stars desc;
Copy and Paste the Resulting Table Below:
+-------+-----------+
| stars | count(id) |
+-------+-----------+
| 5.0 | 1 |
| 4.5 | 1 |
| 4.0 | 2 |
| 3.5 | 3 |
| 2.5 | 2 |
| 1.5 | 1 |
+-------+-----------+
ii. Beachwood
SQL code used to arrive at answer:
select
stars,
count(id)
from business
where city ='Beachwood'
group by stars
order by stars desc;
Copy and Paste the Resulting Table Below:
+-------+-----------+
| stars | count(id) |
+-------+-----------+
| 5.0 | 5 |
| 4.5 | 2 |
| 4.0 | 1 |
| 3.5 | 2 |
| 3.0 | 2 |
| 2.5 | 1 |
| 2.0 | 1 |
+-------+-----------+
7. Find the top 3 users based on their total number of reviews:
SQL code used to arrive at answer:
select
id,
review_count
from user
order by review_count desc
limit 3;
Copy and Paste the Result Below:
+------------------------+--------------+
| id | review_count |
+------------------------+--------------+
| -G7Zkl1wIWBBmD0KRy_sCw | 2000 |
| -3s52C4zL_DHRK0ULG6qtg | 1629 |
| -8lbUNlXVSoXqaRRiHiSNg | 1339 |
+------------------------+--------------+
8. Does posing more reviews correlate with more fans?
Please explain your findings and interpretation of the results:
Use the SQL code below, we can calculate the r_squared of 0.43, which is half way between 0 and 1 . This means 43% of movements in fans can be explained by movements in review_count. Hence, we can conclude that having more review slightly correlate with more fans.
select
c*c/d/e as r_squared
from (
select
sum(a*b) as c,
sum(a*a) as d,
sum(b*b) as e
from (
select
review_count - avgx as a,
fans - avgy as b
from user,(
select
avg(review_count) as avgx,
avg(fans) as avgy
from user)));
9. Are there more reviews with the word "love" or with the word "hate" in them?
Answer: More reviews with the word "love"
SQL code used to arrive at answer:
select
Count(*),
'hate'
from review
where text like 'hate%' or text like '%hate' or text like '%hate%'
union
select
Count(*),
'love'
from review
where text like 'love%' or text like '%love' or text like '%love%';
10. Find the top 10 users with the most fans:
SQL code used to arrive at answer:
select
id,
fans
from user
order by fans desc
limit 10;
Copy and Paste the Result Below:
+------------------------+------+
| id | fans |
+------------------------+------+
| -9I98YbNQnLdAmcYfb324Q | 503 |
| -8EnCioUmDygAbsYZmTeRQ | 497 |
| --2vR0DIsmQ6WfcSzKWigw | 311 |
| -G7Zkl1wIWBBmD0KRy_sCw | 253 |
| -0IiMAZI2SsQ7VmyzJjokQ | 173 |
| -g3XIcCb2b-BD0QBCcq2Sw | 159 |
| -9bbDysuiWeo2VShFJJtcw | 133 |
| -FZBTkAZEXoP7CYvRV2ZwQ | 126 |
| -9da1xk7zgnnfO1uTVYGkA | 124 |
| -lh59ko3dxChBSZ9U7LfUw | 120 |
+------------------------+------+
Part 2: Inferences and Analysis
1. Pick one city and category of your choice and group the businesses in that city or category by their overall star rating. Compare the businesses with 2-3 stars to the businesses with 4-5 stars and answer the following questions. Include your code.
city = Toronto; category = Restaurants
i. Do the two groups you chose to analyze have a different distribution of hours?
Businesses in the 2-3 star group same similar opening hours, suggesting that they cater to similar customers. The 4-5 star group, on the other hand, has widely different opening hours between them, suggesting they each target a different type of customers.
2-3 star group: typically open from 9-11:00 and close at 21-23:00 everyday of the week (conventional opening hours for restaurants)
select
business.name,
business.city,
category.category,
hours.hours
from (business inner join category on
business.id = category.business_id)
inner join hours on
business.id = hours.business_id
where (business.stars between 2 and 3)
and business.city = 'Toronto'
and category.category = 'Restaurants';
4-5 star group: open hours vary accross businesses: Sushi Osaka one opens traditional hours (11-23:00); Edulis opens for dinners on Wednesday-Saturday and for lunchs on Sunday; Cabin Fever opens from afternoon to 2am the next day.
select
business.name,
business.city,
category.category,
hours.hours
from (business inner join category on
business.id = category.business_id)
inner join hours on
business.id = hours.business_id
where (business.stars between 4 and 5)
and business.city = 'Toronto'
and category.category = 'Restaurants';
ii. Do the two groups you chose to analyze have a different number of reviews?
Overall, the number of reviews vary between the two groups, but also among businesses in the same group. Both groups have business(s) with less than 10 reviews but also have some with a lot of reviews. However, the 4-5 star group have more reviews on average.
2-3 star group:
select
avg(business.review_count) as avg,
min(business.review_count) as min,
max(business.review_count) as max,
sum(business.review_count) as sum
from (business inner join category on
business.id = category.business_id)
where (business.stars between 2 and 3)
and business.city = 'Toronto'
and category.category = 'Restaurants';
Copy and Paste the Result Below:
+---------------+-----+-----+-----+
| avg | min | max | sum |
+---------------+-----+-----+-----+
| 28.6666666667 | 5 | 47 | 86 |
+---------------+-----+-----+-----+
4-5 star group:
select
avg(business.review_count) as avg,
min(business.review_count) as min,
max(business.review_count) as max,
sum(business.review_count) as sum
from (business inner join category on
business.id = category.business_id)
where (business.stars between 4 and 5)
and business.city = 'Toronto'
and category.category = 'Restaurants';
Copy and Paste the Result Below:
+------+-----+-----+-----+
| avg | min | max | sum |
+------+-----+-----+-----+
| 41.2 | 8 | 89 | 206 |
+------+-----+-----+-----+
iii. Are you able to infer anything from the location data provided between these two groups? Explain.
Businesses with similar star ratings tend to stay close to each other (clustering). Clustering can be explained by game theory and specifically by “Hotelling’s Model of Spatial Competition.” In this case, 4-5 star restaurants stay further to the West (longitude < -79.4) and 2-3 star restaurants can be found on the East (longitude > -79.4).
SQL code used for analysis:
select
business.latitude,
business.longitude,
"4-5" as rating
from (business inner join category on
business.id = category.business_id)
where (business.stars between 4 and 5)
and business.city = 'Toronto'
and category.category = 'Restaurants'
union all
select
business.latitude,
business.longitude,
"2-3"
from (business inner join category on
business.id = category.business_id)
where (business.stars between 2 and 3)
and business.city = 'Toronto'
and category.category = 'Restaurants';
Copy and Paste the Result Below:
+----------+-----------+--------+
| latitude | longitude | rating |
+----------+-----------+--------+
| 43.6809 | -79.4302 | 4-5 |
| 43.6553 | -79.4567 | 4-5 |
| 43.6452 | -79.5324 | 4-5 |
| 43.7766 | -79.4142 | 4-5 |
| 43.6419 | -79.4066 | 4-5 |
| 43.6546 | -79.3805 | 2-3 |
| 43.6614 | -79.379 | 2-3 |
| 43.6479 | -79.3901 | 2-3 |
+----------+-----------+--------+
2. Group business based on the ones that are open and the ones that are closed. What differences can you find between the ones that are still open and the ones that are closed? List at least two differences and the SQL code you used to arrive at your answer.
i. Difference 1:
There are some attributes that businesses that close do not have, in comparison to businesses that open (Notably BusinessAcceptsCreditCards, RestaurantPriceRange2, BusinessParking and Bike Parking).
select
business.is_open,
attribute.name,
count(*)
from business inner join attribute on
business.id = attribute.business_id
group by
business.is_open,
attribute.name
order by count(*) desc;
Copy and Paste the Result Below:
+---------+----------------------------+----------+
| is_open | name | count(*) |
+---------+----------------------------+----------+
| 1 | BusinessAcceptsCreditCards | 62 |
| 1 | RestaurantsPriceRange2 | 44 |
| 1 | BusinessParking | 41 |
| 1 | BikeParking | 36 |
| 1 | RestaurantsTakeOut | 29 |
| 1 | GoodForKids | 28 |
| 1 | RestaurantsGoodForGroups | 28 |
| 1 | OutdoorSeating | 26 |
| 1 | RestaurantsReservations | 26 |
| 1 | RestaurantsDelivery | 25 |
| 1 | NoiseLevel | 24 |
| 1 | Ambience | 23 |
| 1 | HasTV | 23 |
| 1 | RestaurantsAttire | 23 |
| 1 | Alcohol | 22 |
| 1 | GoodForMeal | 22 |
| 1 | RestaurantsTableService | 22 |
| 1 | WiFi | 22 |
| 1 | ByAppointmentOnly | 21 |
| 1 | WheelchairAccessible | 20 |
| 1 | Caters | 19 |
| 0 | BusinessAcceptsCreditCards | 12 |
| 0 | RestaurantsPriceRange2 | 12 |
| 0 | BusinessParking | 10 |
| 0 | OutdoorSeating | 9 |
+---------+----------------------------+----------+
ii. Difference 2:
Businesses that close have no more than 3 checkins, whereas businesses that open can have upto 17 checkins.
SQL code used for analysis:
select
business.is_open,
checkin.count,
count(checkin.count) as frequency
from business inner join checkin on
business.id = checkin.business_id
group by business.is_open, checkin.count
Copy and Paste the Result Below:
+---------+-------+-----------+
| is_open | count | frequency |
+---------+-------+-----------+
| 0 | 1 | 10 |
| 0 | 2 | 1 |
| 0 | 3 | 1 |
| 1 | 1 | 331 |
| 1 | 2 | 92 |
| 1 | 3 | 45 |
| 1 | 4 | 12 |
| 1 | 5 | 8 |
| 1 | 6 | 3 |
| 1 | 7 | 3 |
| 1 | 8 | 1 |
| 1 | 9 | 1 |
| 1 | 12 | 1 |
| 1 | 17 | 1 |
+---------+-------+-----------+
3. For this last part of your analysis, you are going to choose the type of analysis you want to conduct on the Yelp dataset and are going to prepare the data for analysis.
i. Indicate the type of analysis you chose to do: How long does it take, on average, for a user to join the Elite squad since they start yelping.
ii. Write 1-2 brief paragraphs on the type of data you will need for your analysis and why you chose that data:
To arrive at the final dataset, we need to find the year that a person starts yelping and the first year that person is an elite. To extract the year from the yelping_since column in user, we use strftime function. Then, we use the min function to grab the first a person become elite. Finally, we subtract the first yelping year from the first elite year and calculate the average of all the results. Overall, it takes almost 2 years (1.9) to reach elite status.
iii. Output of your finished dataset:
+---------------+
| avg_time |
+---------------+
| 1.90476190476 |
+---------------+
iv. Provide the SQL code you used to create your final dataset:
select
avg(first_e_year-first_y_year) as avg_time
from (
select
user.id as id,
strftime('%Y',user.yelping_since) as first_y_year,
min(elite_years.year) as first_e_year
from user inner join elite_years on
user.id = elite_years.user_id
group by user.id);